
The Geography of Livability: Insights from AARP’s Livability Index
Last month, we released a co-authored report with the AARP Public Policy Institute examining the characteristics of neighborhoods scoring highly on AARP’s Livability Index and the profile of older adults in those neighborhoods. In an additional analysis, the Center used AARP’s Livability Index to consider how livability varies by geography. We found that all regions, states, and neighborhood types in the country have some livable features, but the Northeast and Midwest rank highest on livability, as do city neighborhoods across the country.
The AARP Livability Index offers a multifaceted approach to understanding what makes communities livable for people of all ages. The index is composed of seven categories: engagement, environment, health, housing, neighborhood, opportunity, and transportation. Each category includes several metrics drawn from publicly available data sources. Table 1 gives a brief description of what the categories encompass.
Table 1: The AARP Livability Index Consists of Seven Categories
| Livability Category | Description |
|---|---|
| Engagement | Civic and social engagement; quality and cost of internet access |
| Environment | Water and air quality |
| Health | Healthy behaviors of residents; access to health care; quality of health care |
| Housing | Accessibility; diversity of housing options; affordability |
| Neighborhood | Proximity to destinations; mixed use; compactness; personal safety; quality |
| Opportunity | Economic and educational opportunity; multi-generational |
| Transportation | Convenient options; affordability; accessible transit systems; safe streets |
To look at differences in livability by geography, we used the Index at the block group level and analyzed average scores across regions, states, metros, and neighborhood types. We also split the Index scores into fifths, looking at how block groups at each geographic scale were distributed across these national quintiles.
By region of the country, neighborhoods in the Northeast and Midwest are more likely to rank high on livability. In the Northeast region, 32 percent of neighborhoods are in the top national quintile, as are 24 percent of those in the Midwest, 20 percent in the West, and just 9 percent in the South. The South has the highest share of its neighborhoods in the lowest livability quintile of all regions (32 percent).
On average, block groups in the Northeast also have the highest overall livability score of 53.8, nearly 5 points higher than the average of 49.0 in the South. Northeastern communities score higher than all other regions in three categories: engagement, neighborhood, and transportation. And though they score lowest on the overall index, Southern neighborhoods score higher than those in any other region on housing and are among the top scoring for environment (Figure 1).
Figure 1: Neighborhoods in the Northeast and Midwest Score Highest on Overall Livability
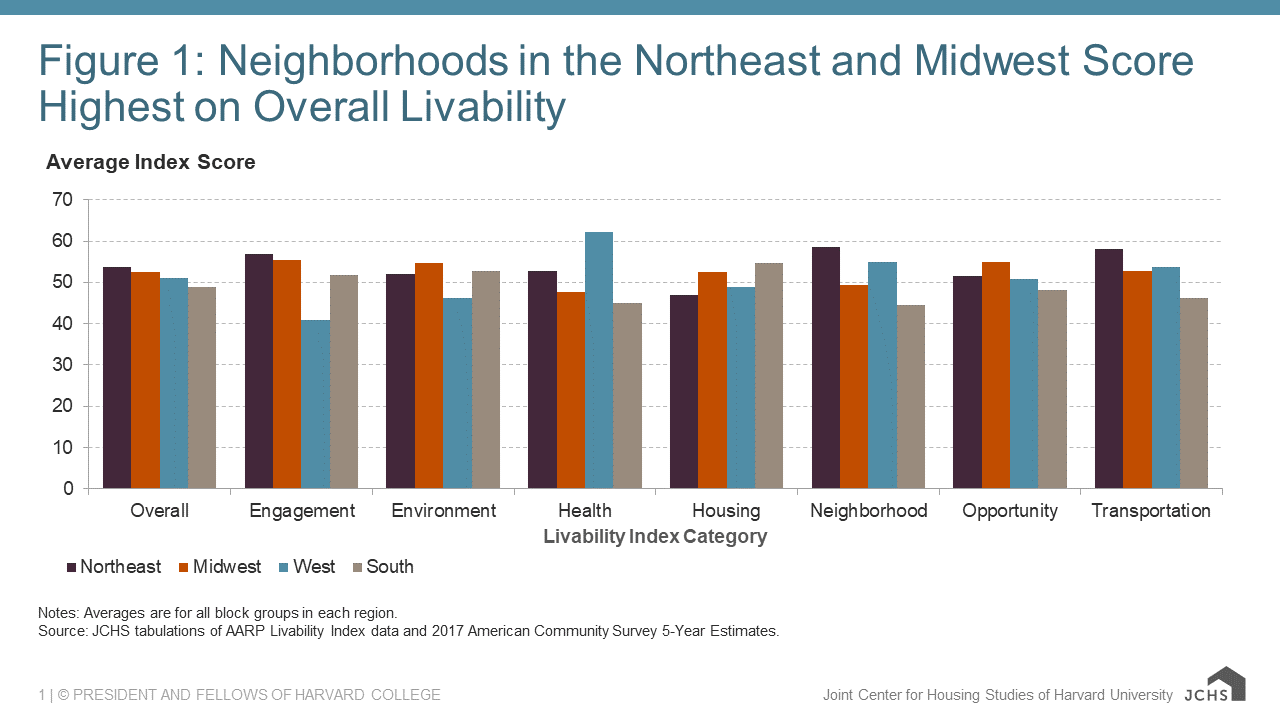
Notes: Averages are for all block groups in each region.
Source: JCHS tabulations of AARP Livability Index data and 2017 American Community Survey 5-Year Estimates.
While the Northeast as a region is generally more livable, states in the Midwest are among the top scoring. The state with the highest average livability score is Minnesota at 58.6 while Wisconsin and Iowa are close behind. All three states score particularly highly on engagement and opportunity and also have the highest shares of neighborhoods in the top quintile. In Minnesota, 67 percent of neighborhoods fall into the most livable category, as do about half of the block groups in Wisconsin and Iowa.
With an average score of 52.1, metropolitan areas have greater livability than smaller micropolitan (48.1) and rural (46.1) areas, and also have a much larger share of metro block groups in the top livability quintile. Given the state and regional trends, it’s unsurprising that five of the largest metros with the highest livability scores are located in the Midwest while another three are in the Northeast.
Within metro areas, urban neighborhoods are generally more livable communities. Less than 20 percent of suburban block groups (17.9 percent) are among the most livable neighborhoods nationally, while 29 percent of block groups in cities are highly livable (Figure 2). Urban neighborhoods also score slightly higher than suburban neighborhoods overall, with an average index score of 53.3 as compared to 51.4. With a more diverse housing stock and urban amenities, urban neighborhoods score higher on housing, neighborhood, and transportation in particular. Meanwhile, suburban communities score particularly high on health and opportunity.
Figure 2: A Larger Share of Urban Block Groups Fall in the Top Fifth of Neighborhoods Nationally
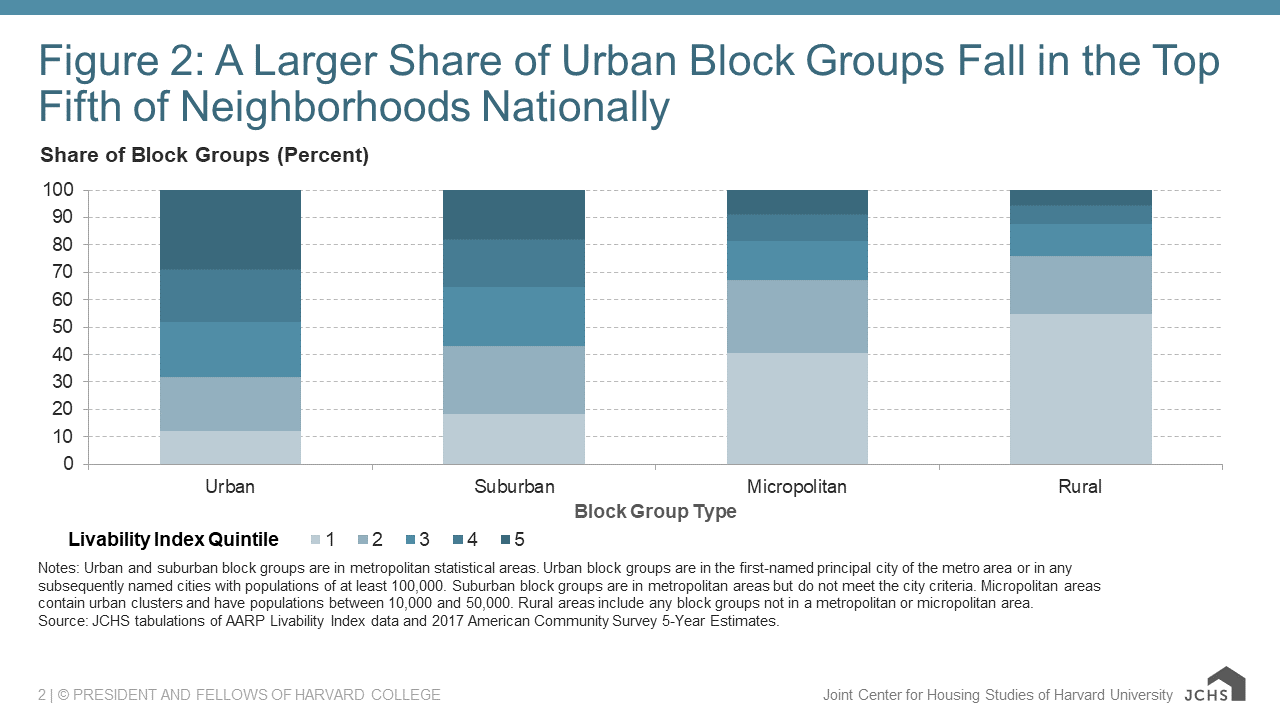
Notes: Urban and suburban block groups are in metropolitan statistical areas. Urban block groups are in the first-named principal city of the metro area or in any subsequently named cities with populations of at least 100,000. Suburban block groups are in metropolitan areas but do not meet the city criteria. Micropolitan areas contain urban clusters and have populations between 10,000 and 50,000. Rural areas include any block groups not in a metropolitan or micropolitan area.
Source: JCHS tabulations of AARP Livability Index data and 2017 American Community Survey 5-Year Estimates.
While there are some clear geographic patterns in livability, all neighborhoods have the potential to become a highly livable community. Even places that score lower on the Livability Index have assets to offer and can become more livable places for people of all ages. The great benefit of the Index is that it enables communities to recognize the features they already have and identify areas for improvement. Ultimately, all types of communities can work toward becoming livable places for all.